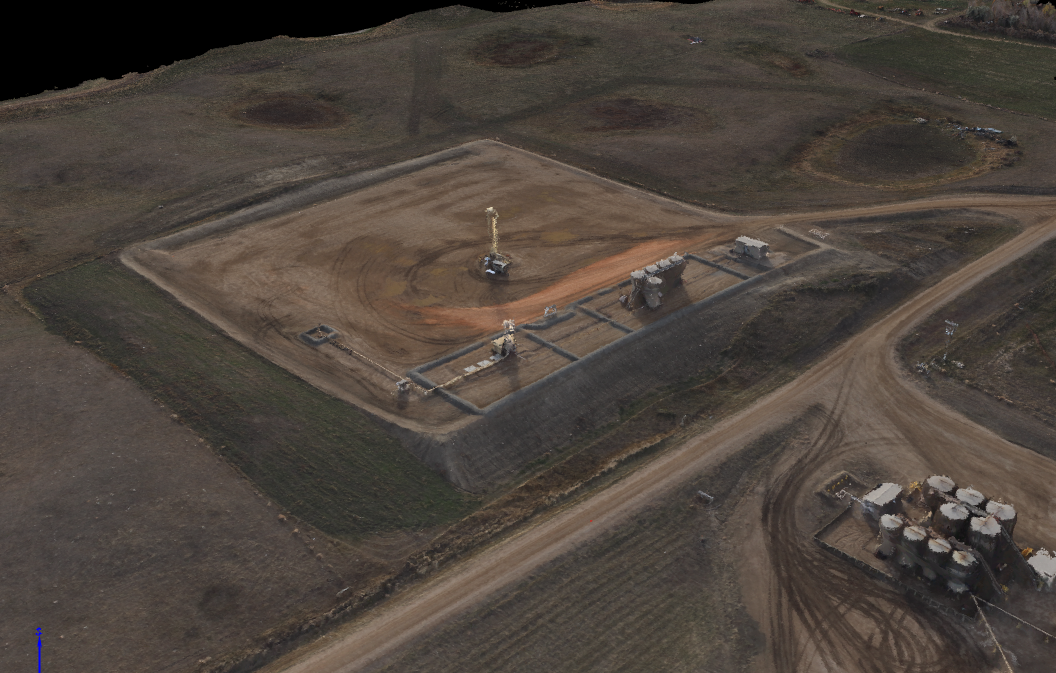
The Densified Point Cloud is a set of 3D points that reconstruct the model. The X,Y,Z position and the color information is stored for each point of the Densified Point Cloud and provides a very accurate background for distance, surface and volume measurements.
Author: Kincade
Orthomosaic
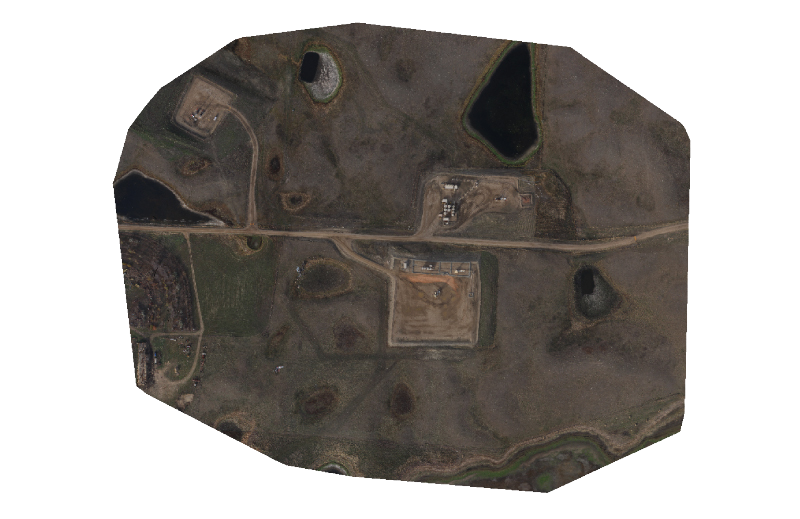
The orthomosaic is a 2D map. Each point contains X, Y and color information. The orthomosaic has uniform scale and can be used for 2D measurements (distance, surface).
Orthomosaic uses
- Asset Management
- Up to date image analysis
- Environmental Planning
- Google Earth Overlay
Digital Terrain and Surface Models
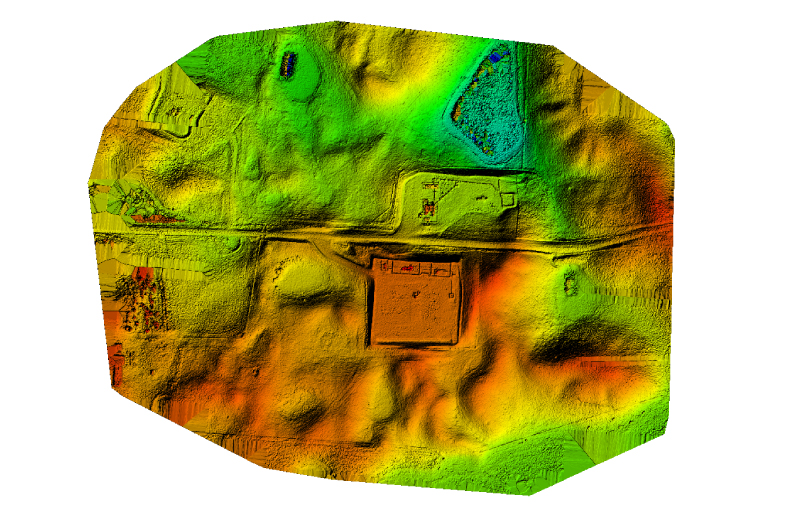
The DSM (Digital Surface Model) is a model of the mapped area that includes objects such as buildings. The DTM (Digital Terrain Model) is a model of the area after filtering out objects such as buildings and structures.
Volume
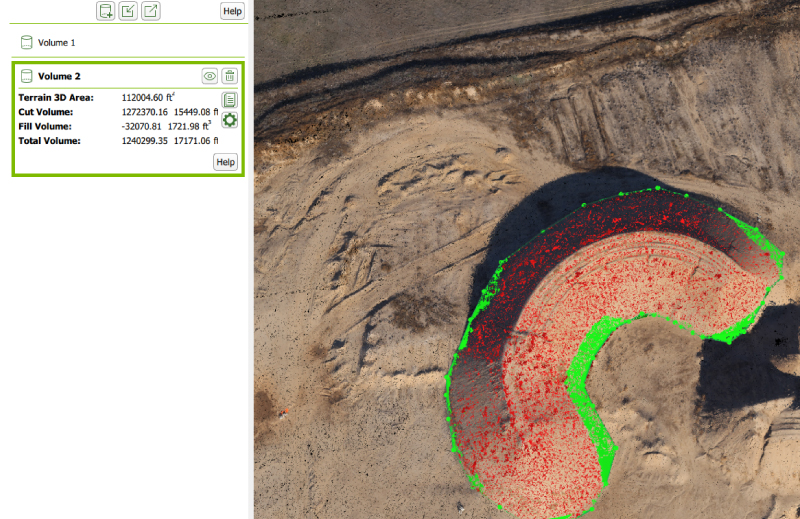
Volume reports are created with the use of the point cloud information that provide accurate data and image of the stockpile or borrow site.
Aggregate / Mining
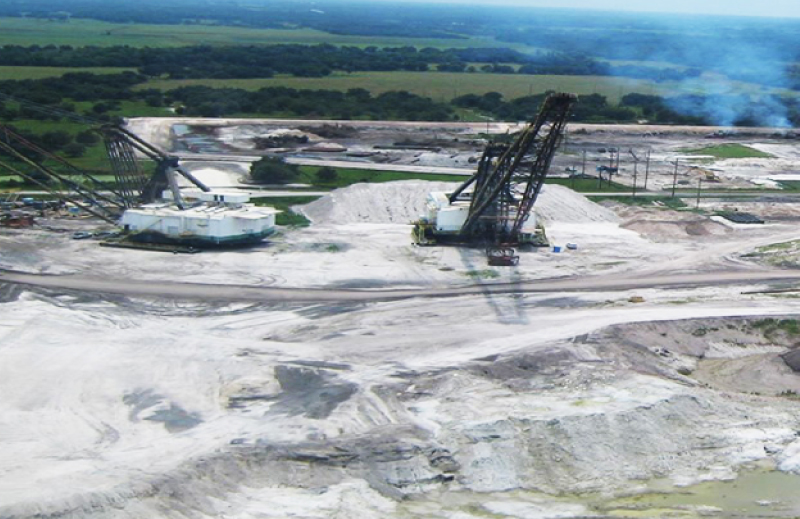
- Volume calculations
- Reclamation plans
Construction Site Mapping
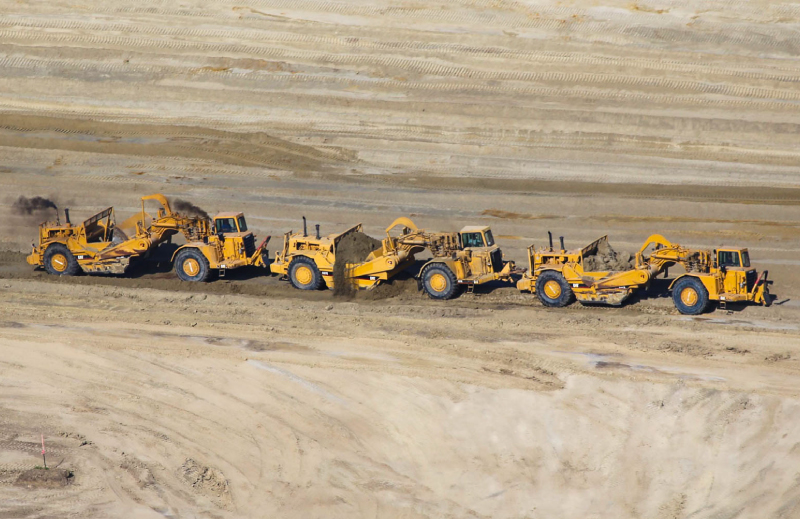
- Pre-bid site visit
- Documentation during construction process
- Earthwork calculations
- As-Builts
Oil and Gas Aerial Mapping
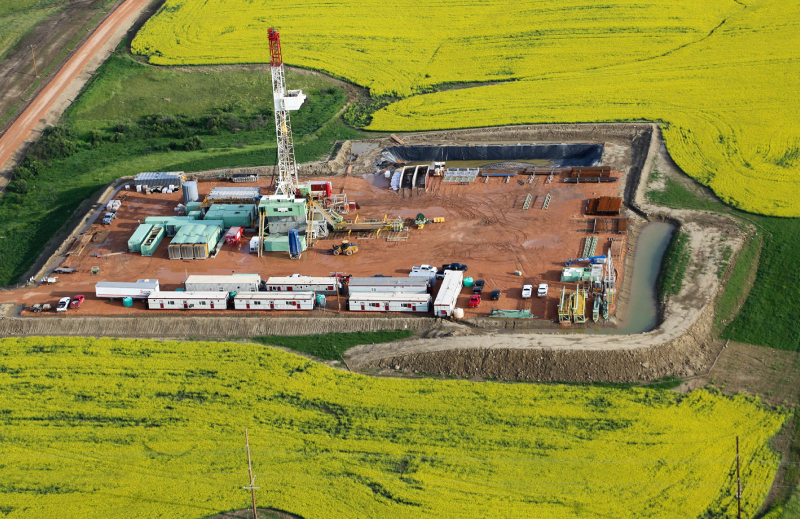
- Site topos
- Aerial Imagery for documentation
- Site Plans
- As Builts
- Pipeline ROW Mapping
- Pre-construction planning
Observation Images
To provide the operator more detailed information of what we see during the inspection photographs of each observation are included in the report
Google Earth Reporting
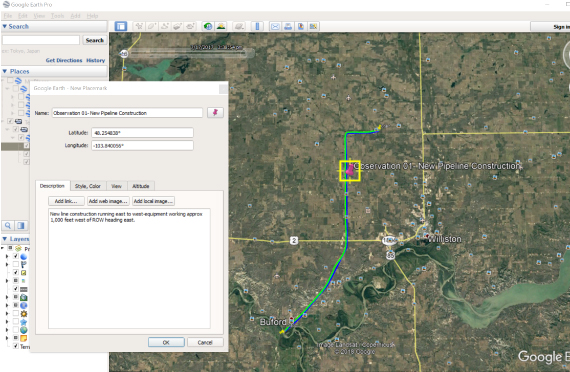
Google Earth is utilized to provide accurate location reporting information of each observation. A Google Earth KML or KMZ file is included within each report upon completion of the flight. This file includes the following information:
- The shape file of the pipeline
- The actual flight track of each inspection, that includes the date and time the line was inspected
- The exact location with description of each observation
Reporting
We understand that the communications between the patrol pilot and the pipeline operator is equally as important as the patrol itself. Our priority is to accurately communicate detailed information of each observation, to the operator as soon as possible this is accomplished this with the use of photographs and accurate maps.
- Our standard reports that are submitted at the end of the patrol include the following information:
- Line Name
- Date and Time of Inspection
- Latitude/Longitude of each observation
- Description of each observation
- Previously reported observations
- Photos of the observation
- Reports can be custom made that best fits the customers’ needs and requirements
- All reports, GIS files and photos are shared with the customer via email and/or Dropbox